
HE BETTER APPOINT A POLL CZAR…
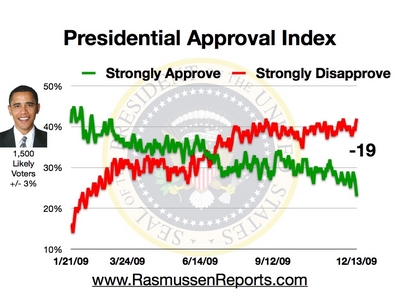
Today is the second straight day that Obama’s Approval Index rating has fallen to a new low. Prior to the past two days, the Approval Index had never fallen below -15 during Obama’s time in office (see trends).
The 23% who Strongly Approve matches the lowest level of enthusiasm yet recorded. Just 41% of Democrats Strongly Approve while 69% of Republicans Strongly Disapprove. Among voters not affiliated with either major party, 21% Strongly Approve and 49% Strongly Disapprove.
Among those who consider the economy to be the most important issue, just 26% Strongly Approve of the President’s performance while 39% Strongly Disapprove.
Among those who consider fiscal policy issues the most important, just 1% Strongly Approve and 81% Strongly Disapprove.
The President’s Approval Index rating is -2 among voters under 30 and -29 among senior citizens. From an income perspective, the President’s ratings are weakest among those who earn $40,000 to $100,000 annually.
Check out our review of the week’s key polls to see “What They Told Us.â€
The Presidential Approval Index is calculated by subtracting the number who Strongly Disapprove from the number who Strongly Approve. It is updated daily at 9:30 a.m. Eastern (sign up for free daily e-mail update). Updates are also available on Twitter and Facebook.
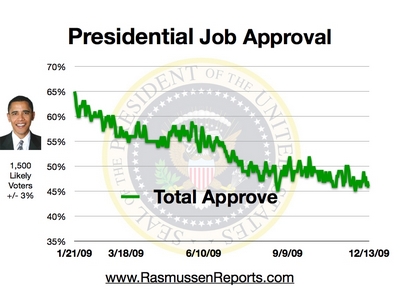
Overall, 46% of voters say they at least somewhat approve of the President’s performance. Fifty-three percent (53%) disapprove.
(More Below)
Most Nevada voters oppose the health care plan working its way through Congress and that’s one reason Senate Majority Leader Harry Reid is trailing a group of little known Republicans in his bid for re-election. Rasmussen Reports has released updated polls on the 2010 Senate races in Arkansas, Colorado, Illinois, Connecticut, Pennsylvania, Ohio, and California. Overall, the results confirm the conventional wisdom that the mid-term election season is off to a tough start for the Democrats. However, there is a long way to go until November.
Scott Rasmussen has recently had several columns published in the Wall Street Journal addressing how President Obama is losing independent voters , health care reform, the President’s approval ratings, and how Obama won the White House by campaigning like Ronald Reagan. If you’d like Scott Rasmussen to speak at your meeting, retreat, or conference, contact Premiere Speakers Bureau. You can also learn about Scott’s favorite place on earth or his time working with hockey legend Gordie Howe.
It is important to remember that the Rasmussen Reports job approval ratings are based upon a sample of likely voters. Some other firms base their approval ratings on samples of all adults. President Obama’s numbers are always several points higher in a poll of adults rather than likely voters. That’s because some of the President’s most enthusiastic supporters, such as young adults, are less likely to turn out to vote. It is also important to check the details of question wording when comparing approval ratings from different firms.
(More Below)
Rasmussen Reports has been a pioneer in the use of automated telephone polling techniques, but many other firms still utilize their own operator-assisted technology (see methodology).
Pollster.com founder Mark Blumenthal noted that “independent analyses from the National Council on Public Polls, the American Association for Public Opinion Research, the Pew Research Center, the Wall Street Journal and FiveThirtyEight.com have all shown that the horse-race numbers produced by automated telephone surveys did at least as well as those from conventional live-interviewer surveys in predicting election outcomes.â€
In the 2009 New Jersey Governor’s race, automated polls tended to be more accurate than operator-assisted polling techniques. On reviewing the state polling results from 2009, Mickey Kaus offered this assessment, “If you have a choice between Rasmussen and, say, the prestigious N.Y. Times, go with Rasmussen!†During Election 2008, Nate Silver of fivethirtyeight.com said that the Rasmussen tracking poll “would probably be the one I’d want with me on a desert island.”
A Fordham University professor rated the national pollsters on their record in Election 2008. We also have provided a summary of our results for your review. In 2008, Obama won 53%-46% and our final poll showed Obama winning 52% to 46%. While we were pleased with the final result, Rasmussen Reports was especially pleased with the stability of our results. On every single day for the last six weeks of the campaign, our daily tracking showed Obama with a stable and solid lead attracting more than 50% of the vote.
An analysis by Pollster.com partner Charles Franklin “found that despite identically sized three-day samples, the Rasmussen daily tracking poll is less variable than Gallup.†During Election 2008, the Rasmussen Reports daily Presidential Tracking Poll was the least volatile of all those tracking the race.
In 2004 George W. Bush received 50.7% of the vote while John Kerry earned 48.3%. Rasmussen Reports was the only firm to project both candidates’ totals within half a percentage point by projecting that Bush would win 50.2% to 48.5%. (see our 2004 results).
Daily tracking results are collected via telephone surveys of 500 likely voters per night and reported on a three-day rolling average basis. The margin of sampling error—for the full sample of 1,500 Likely Voters–is +/- 3 percentage points with a 95% level of confidence. Results are also compiled on a full-week basis and crosstabs for full-week results are available for Premium Members.
Like all polling firms, Rasmussen Reports weights its data to reflect the population at large (see methodology). Among other targets, Rasmussen Reports weights data by political party affiliation using a dynamic weighting process. While partisan affiliation is generally quite stable over time, there are a fair number of people who waver between allegiance to a particular party or independent status. Over the past five years, the number of Democrats in the country has increased while the number of Republicans has decreased.
Our baseline targets are established based upon separate survey interviews with a sample of adults nationwide completed during the preceding three months (a total of 45,000 interviews) and targets are updated monthly. Currently, the baseline targets for the adult population are 37.1% Democrats, 32.4% Republicans, and 30.5% unaffiliated. Likely voter samples typically show a slightly smaller advantage for the Democrats.
A review of last week’s key polls is posted each Saturday morning. Other stats on Obama are updated daily on the Rasmussen Reports Obama By the Numbers page. We also invite you to review other recent demographic highlights from the tracking polls.
Rasmussen Reports is an electronic publishing firm specializing in the collection, publication, and distribution of public opinion polling information.
The Rasmussen Reports Election Edgeâ„¢ Premium Service offers the most comprehensive public opinion coverage available anywhere.
Scott Rasmussen, president of Rasmussen Reports, has been an independent pollster for more than a decade.
Comments are closed.